

July 2026 Turns Ethereum Into a High-Stakes Showdown
The crypto market is never calm for the timid, and July 2026 has amplified the tension. Ethereum (ETH) investors are facing a scenario that feels less like a standard trading cycle and more like a critical standoff. As of July 13, Ethereum trades near $1,779, a figure that appears modest on a spreadsheet but serves as the focal point of a massive multi-layered battle .
Why does $1,800 matter so much? To grasp the current climate, one must look beyond the ticker symbol and examine the “compression zone” that has confined Ethereum for weeks.
The Mechanics of a Price Ceiling
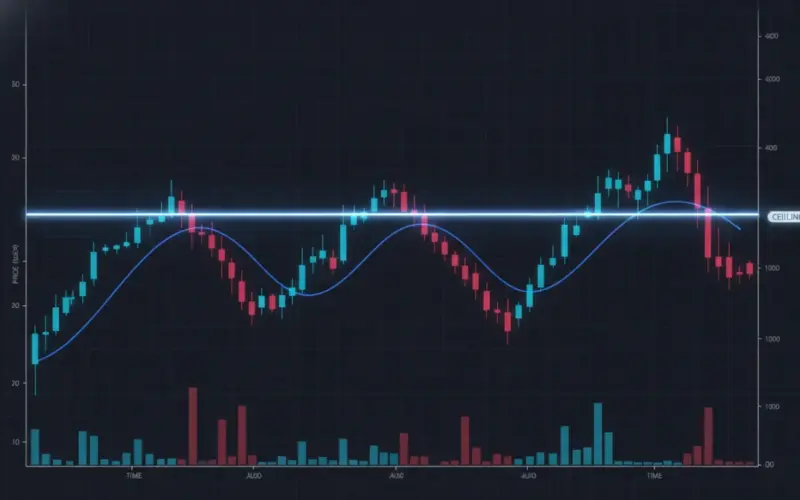
In technical analysis, certain numbers function as magnets while others act as rigid barriers. The $1,799–$1,800 range currently operates as a fortress. This is not merely a random psychological round number; it represents a structural convergence of the daily pivot point, the 50-day Exponential Moving Average (EMA50), and a cluster of short-term resistance levels on hourly charts .
When a price remains pinned beneath these technical markers, the market effectively demands proof of intent. For Ethereum to advance, it requires more than a temporary spike; it needs a decisive, volume-supported close above $1,800 to transform this former ceiling into a new floor. Until that occurs, bears retain a clear mandate to suppress the price and exhaust buyer momentum .
Daily Optimism Versus Hourly Reality
A defining feature of today’s market is “timeframe dissonance.” Long-term investors reviewing the daily chart may feel a spark of hope. Ethereum is holding above its 20-day EMA, and the daily MACD has just signaled a bullish crossover—a classic bottoming indicator suggesting selling pressure is fading .
However, shifting to the 1-hour or 15-minute charts reverses this narrative. On these shorter intervals, the market is unequivocally bearish. Sellers are aggressively defending the $1,800 line, and the Relative Strength Index (RSI) is leaning toward oversold territory. This disconnect between daily “recovery” hopes and hourly “sell-the-rally” realities makes current trading exceptionally treacherous. Buying into this environment without a breakout is akin to running into a headwind .
Macro Headwinds: Bitcoin’s Dominance
Ethereum cannot be analyzed in isolation. Bitcoin dominance currently hovers around 56%, a formidable figure explaining why altcoins struggle to gain independent momentum .
In a “risk-off” environment, capital flows toward perceived safety in market leaders. With geopolitical tensions and macroeconomic uncertainty—including speculation about interest rate shifts—weighing on sentiment, the Fear & Greed Index remains locked in the “Fear” category at 28. When fear dominates, investors seek liquidity and exits rather than “value” in altcoins. This dominance allows Bitcoin to dictate the tempo, leaving Ethereum to fight for redirected volume scraps .
On-Chain Signals: Panic or Strategic Pivot?
A compelling data point from the last 24 hours is the sudden surge in Decentralized Exchange (DEX) activity. Uniswap V3 fees have jumped nearly 49%, while Curve DEX is experiencing a similar explosion in volume .
A fee increase during a market downturn is a classic signal. It rarely indicates a stampede of new buyers entering the market; instead, it screams “active repositioning.” Investors are likely moving tokens to cold storage, rebalancing portfolios, or frantically hedging against further downside. This activity suggests the market is twitchy, with participants bracing for volatility rather than leaning into a bull run .
Mapping the Path Forward
We are effectively facing two distinct realities for the coming week:
1. The Bullish Breakout
If Ethereum achieves a sustained hourly close above $1,800, the technical landscape shifts instantly. This breach would likely trigger a short-squeeze, forcing those who bet on resistance to buy back positions, creating a self-fulfilling pump. This would open the path to $1,825, with potential to test upper Bollinger bands near $1,884. To bulls, $1,800 is the key unlocking a genuine recovery .
2. The Bearish Slide
If the $1,800 wall holds and we see a breakdown of the $1,753 support level, momentum evaporates. Below $1,753 lies a “structural vacuum,” meaning significantly less historical buying interest, which could cause rapid price slippage. In a fear-driven market, losing the current floor could invite technical selling that tests even hardened holders .
The Strategy: Patience in Volatility
For the average trader or investor, the lesson is simple: Do not fight the range.
Flipping coins while price is pinned between $1,753 and $1,800 is a high-risk, low-reward game of chance. You are essentially betting on randomness rather than confirmed direction. Patience is the most valuable asset in this volatile regime .